The record
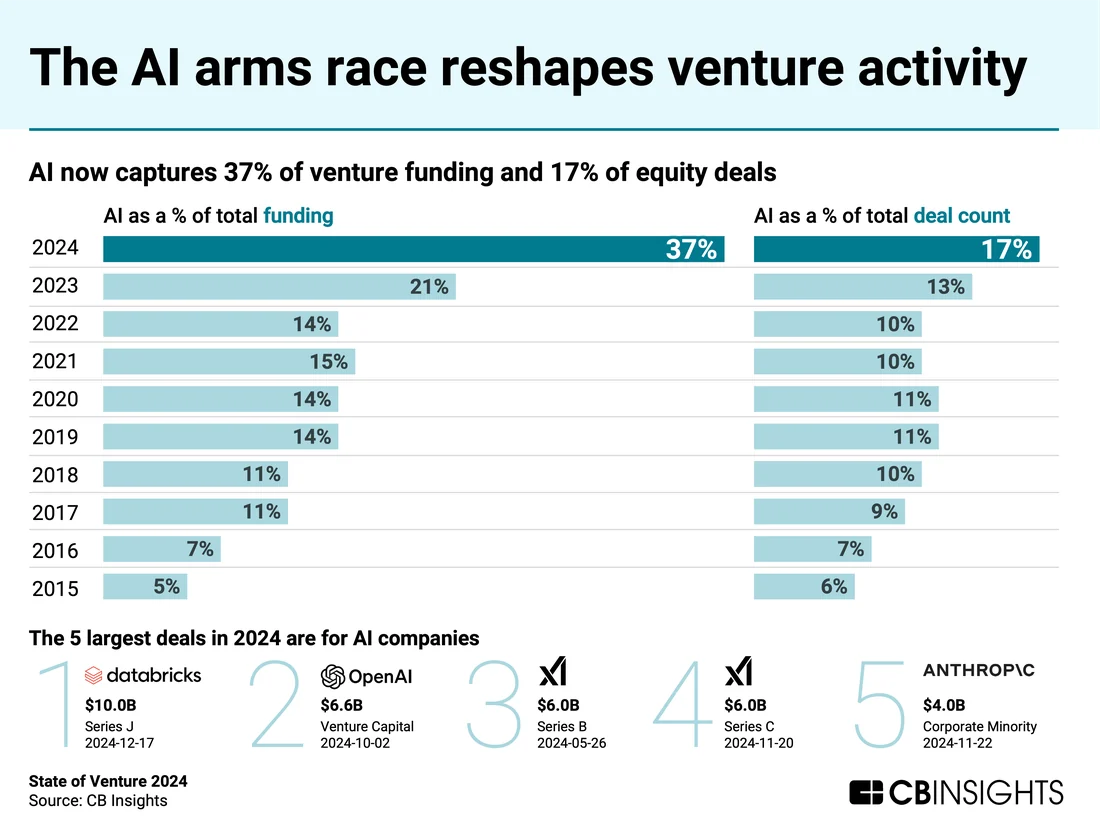
Across three providers and multiple quarters, a small number of the largest rounds routinely account for most of a period's reported growth. CB Insights' State of Venture 2024 Report states that in the fourth quarter of 2024, mega-rounds of $100 million or more made up "60% of that quarterly total, or $52B" of the reported $86.2 billion. Crunchbase's year-end 2024 recap states that billion-dollar rounds took "$58.3 billion — or 19% of all funding" for the year, up from "$45.8 billion — or 15% of funding" in 2023. PitchBook's Q1 2026 Venture Monitor states that "without the five largest deals and exits, those figures fall by 73.2% and 86.6%, respectively," against a reported $267.2 billion in quarterly deal value and $347.3 billion in exit value.
What the sources establish
Each provider's own breakdown shows the concentration: CB Insights names the mega-round dollar figure inside its quarterly total, Crunchbase compares a year-over-year share of a round-size band, and PitchBook states what its headline figures would be without its five largest deals and exits. Dealroom's half-time report on H1 2026, published 30 July 2026, shows the same pattern at the extreme: "startups raised over $500B in venture capital in H1 2026," but excluding three named companies, OpenAI, Anthropic and xAI, the same activity implies "a $269B full-year projection," according to the report. A total near $500 billion and a total near $269 billion are both true statements from the same provider about overlapping activity; the difference is entirely which handful of rounds are included.
Scope and revision
These breakdowns cover the share of one dollar total attributable to the largest few disclosed rounds, as each provider defines "largest": a size threshold for CB Insights, a size band for Crunchbase, a named count of top deals for PitchBook, named companies for Dealroom. They do not establish that concentration is rising in every series by the same amount, since the figures come from different quarters, geographies and definitions of a mega-round. A headline total's percentage change, quarter over quarter or year over year, should not be read as evidence of broad-based market strength when a cited breakdown shows most of the dollar movement sitting in a handful of rounds.
The decision in front of you
A founder outside the small set of companies raising nine- or ten-figure rounds should treat a rising total as weak evidence about their own fundraising conditions, and instead look for the same report's deal count, or its ex-mega-round total where the provider states one, as the more relevant benchmark. This is an editorial reading of what each report's own breakdown supports.
- Does the reported total's growth survive removing the largest few disclosed rounds, per the source's own breakdown?
- What does the provider count as a mega-round, and does that threshold match the deal sizes I actually care about?
- Am I citing a total, or the more informative concentration share the same report also states?
A market total swung by a handful of companies is not a false number; it is a true number about a narrower slice of the market than its headline implies.
Sources & reading trail
States the mega-round dollar share of Q4 2024 global venture funding.
Source published: 7 January 2025 · Retrieved: 16 September 2026
States the billion-dollar-round share of 2024 and 2023 global funding for comparison.
Source published: 7 January 2025 · Retrieved: 16 September 2026
States how much Q1 2026 deal and exit values fall once the five largest deals and exits are excluded.
Source published: 15 April 2026 · Retrieved: 16 September 2026
Shows the H1 2026 global total falling from about $500B to a $269B projection once three named AI companies are excluded.
Source published: 30 July 2026 · Retrieved: 16 September 2026
Filings, provider reports and official documents establish the record; the scope reading and the decision framing are Venture Trace editorial analysis. This retrospective draft does not imply the site published on the event date.