The record
Renaissance Capital, the IPO-focused investment adviser that runs the Renaissance IPO ETF, publishes an annual U.S. IPO market review. Its 2022 Annual Review records 71 IPOs raising $7.7 billion that year, calling it "the slowest year by proceeds ever recorded in Renaissance Capital's 30+ year history." Its 2024 Annual Review records a partial recovery: 108 IPOs raising $19.4 billion in 2023, then 150 IPOs raising $29.6 billion in 2024, a year the firm calls "solid but underwhelming." Each figure carries the same scope note: the count "includes IPOs and direct listings with a market cap of at least $50mm and excludes closed-end funds and SPACs."
What the sources establish
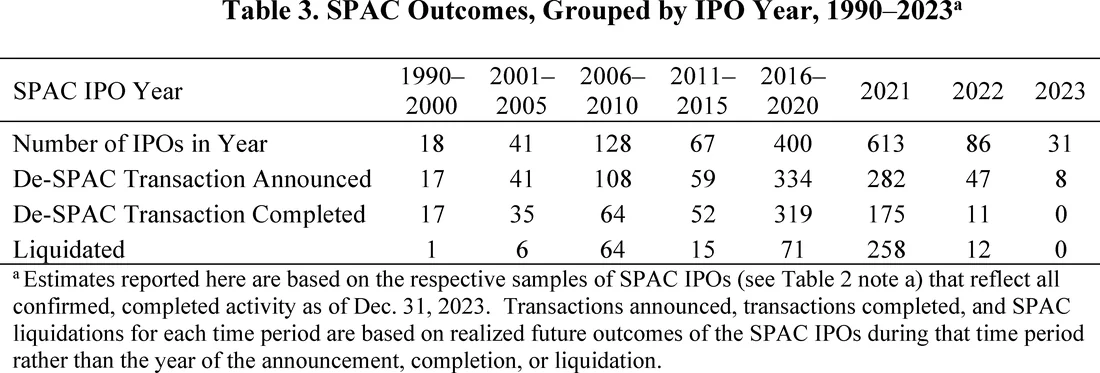
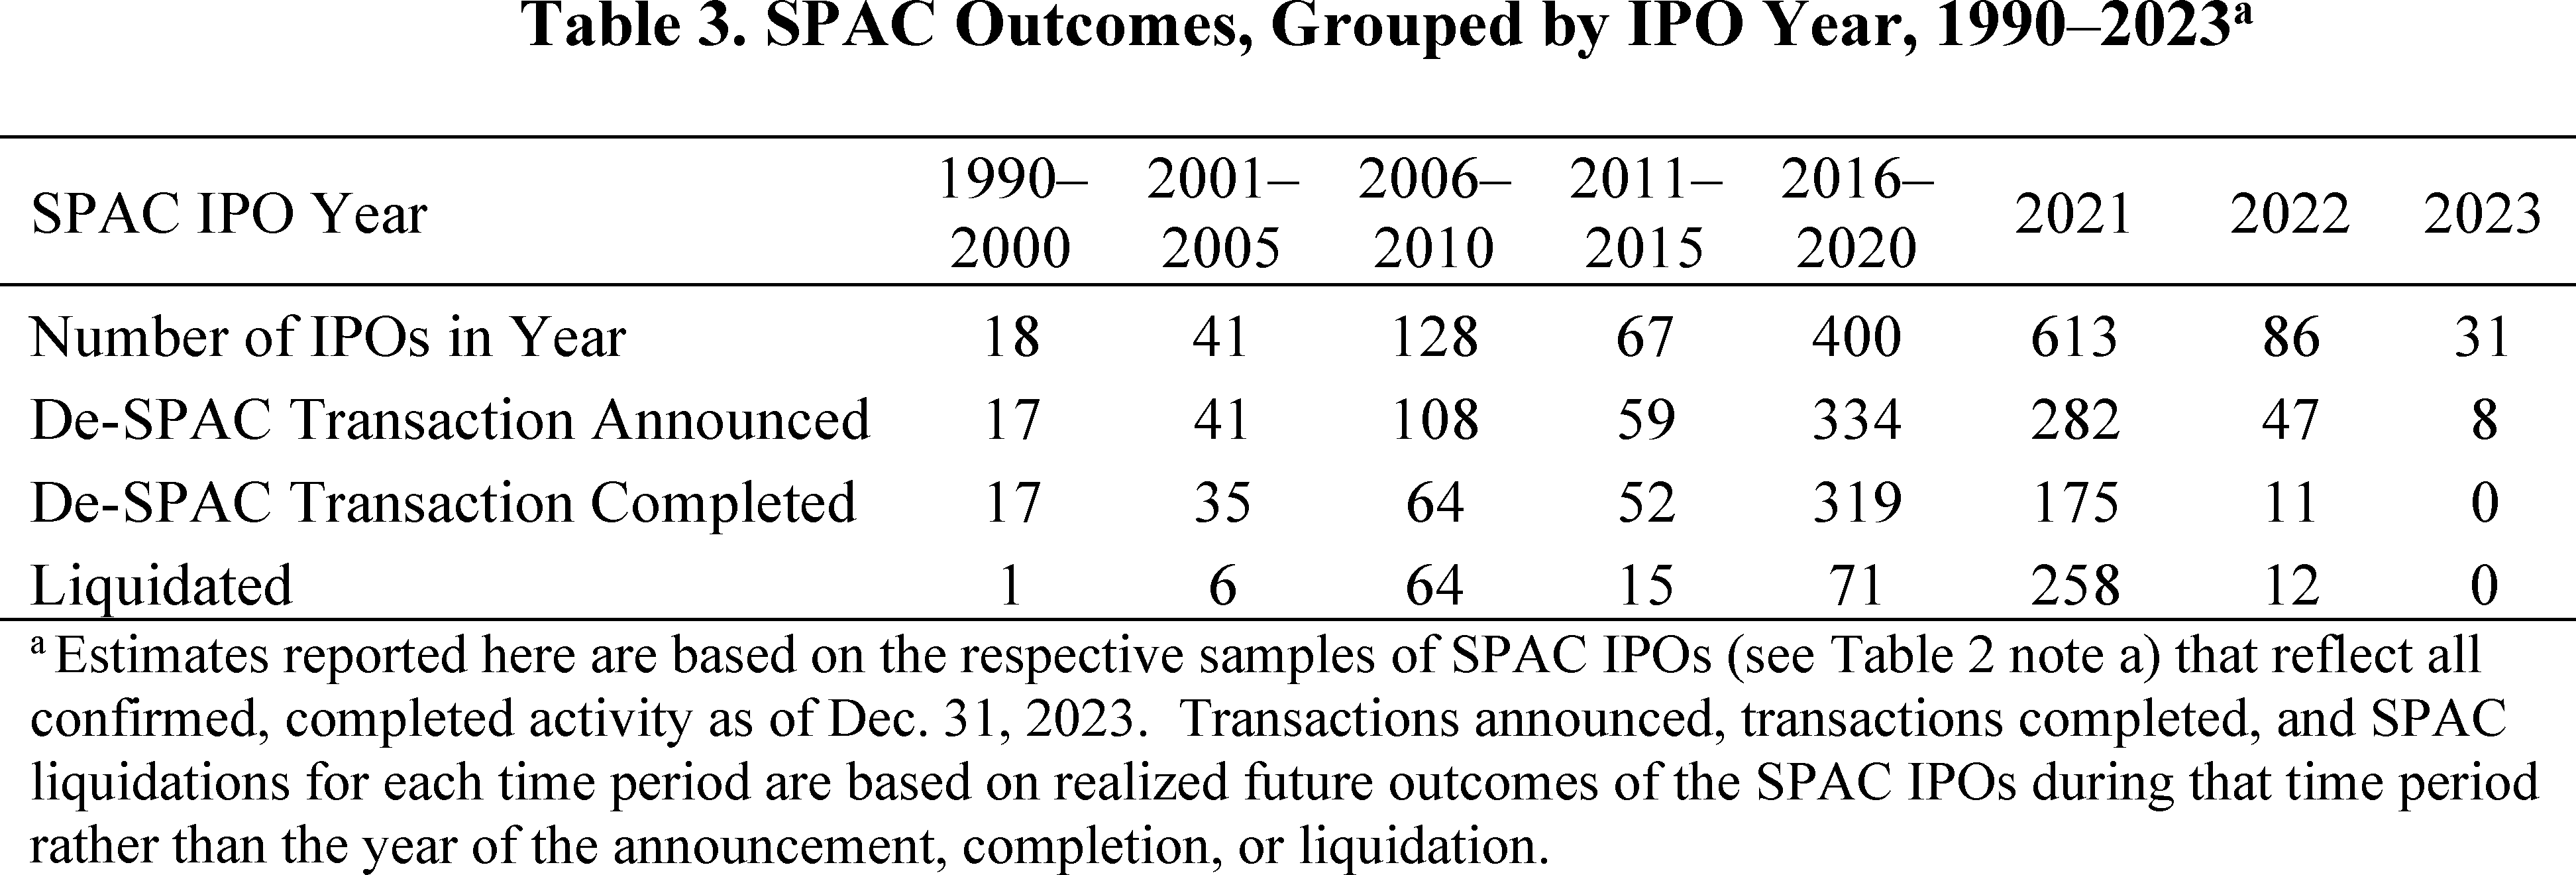
A second tally, compiled by the U.S. Securities and Exchange Commission for its 2024 adopting release on special-purpose acquisition companies, counts IPOs differently. Sourced from SPAC Analytics data cited in the release's Table 1, it reports 118 total IPOs, including SPACs, in 2022 and 72 in 2023 — both lower than Renaissance's SPAC-excluded counts of 71 and 108 for the same two years measured a different way, because the two universes are built on different rules: SPAC Analytics includes blank-check issuers Renaissance excludes and does not appear to apply Renaissance's $50 million market-cap floor. What both sources agree on, independently measured, is direction: a collapse beginning in 2022 and a slow, incomplete rebuild through 2024.
Scope and revision
Neither series is a market total. Renaissance's count values dollar volume and issuer count using a market-cap floor and an explicit SPAC exclusion; the SEC table's SPAC Analytics-sourced figures are called estimates in the release's own footnote and are organized around SPAC status, not company size or sector. Proceeds concentration adds a further wrinkle: Renaissance's 2024 review notes that five deals above $1 billion, led by cold-storage REIT Lineage's $4.4 billion raise, produced 33% of that year's total IPO proceeds — meaning the count of 150 IPOs and the dollar figure of $29.6 billion did not move together, and a handful of large, not-necessarily-venture-backed issuers can dominate the total. Neither series measures what a venture investor recovered at exit; an IPO count is a listings tally, not a return.
The decision in front of you
Editorially: before citing that "the IPO market is open" or "closed," a founder, a later-stage employee, or an analyst should ask which count is being quoted, whether SPACs sit inside or outside it, whether a market-cap floor excludes the smallest deals, and whether the headline dollar figure is being driven by a few outsized, possibly non-venture issuers rather than a broad recovery.
- Does the IPO count include or exclude SPACs, and does that match the claim being made?
- Is the dollar total concentrated in a handful of billion-dollar deals, or spread across many issuers?
- Are the companies in the count venture-backed at all, or drawn from REITs, biotech, and other sectors?
A 71-to-150 IPO count and a $7.7-billion-to-$29.6-billion swing describe a real recovery in issuer counts on one provider's terms, but the two sources cited here do not measure the same universe, and neither measures what a venture investor actually recovers at exit.
Sources & reading trail
States 71 IPOs raised $7.7 billion in 2022, the slowest year by proceeds in the firm's history, and the count's methodology.
Source published: 3 January 2023 · Retrieved: 16 September 2026
States 108 IPOs in 2023 and 150 IPOs raising $29.6 billion in 2024, the $50mm/SPAC-excluded scope note, and the Lineage/billion-dollar-deal concentration.
Source published: 2 January 2025 · Retrieved: 16 September 2026
Table 1 gives total U.S. IPO counts including SPACs by year (118 in 2022, 72 in 2023), sourced from SPAC Analytics per the release's footnote.
Source published: 26 February 2024 · Retrieved: 16 September 2026
Filings, provider reports and official documents establish the record; the scope reading and the decision framing are Venture Trace editorial analysis. This retrospective draft does not imply the site published on the event date.